|
|
|
|
|
|
|
|
|
|
|
|
|
|
|
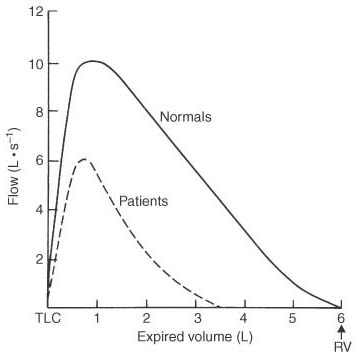
Figure 26-6
Idealized maximum expiratory flow-volume curves for normal
subjects are contrasted with those typically seen for patients with obstructive airway
disease. Expiratory flow is plotted as a function of lung volume during maximum
expiration from total lung capacity (TLC) to residual volume (RV).
|
|
|
|
|
|
|
|
|
|
|
|
|
|