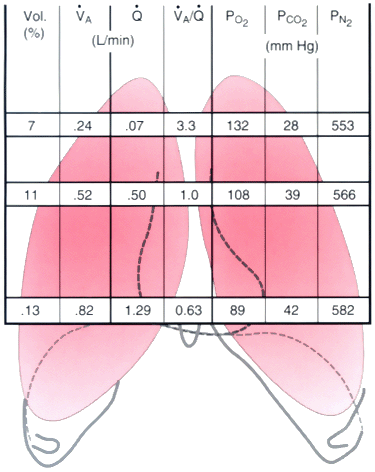
Figure 17-5
Ventilation-perfusion ratio (V̇A/ )
and the regional composition of alveolar gas. Values for regional flow (),
ventilation (V̇A), PO2
,
and PCO2
were derived from Figure
17-4
. PN2
was obtained by what
remains from total gas pressure (which, including water vapor, equals 760 mm Hg).
The volumes [Vol. (%)] of the three lung slices are also shown. When compared with
the top of the lung, the bottom of the lung has a low V̇A/
ratio and is relatively hypoxic and hypercapnic. (Redrawn from West JB:
Regional differences in gas exchange in the lung of erect man. J Appl Physiol 17:893,
1962.)
)
and the regional composition of alveolar gas. Values for regional flow (),
ventilation (V̇A), PO2
,
and PCO2
were derived from Figure
17-4
. PN2
was obtained by what
remains from total gas pressure (which, including water vapor, equals 760 mm Hg).
The volumes [Vol. (%)] of the three lung slices are also shown. When compared with
the top of the lung, the bottom of the lung has a low V̇A/
ratio and is relatively hypoxic and hypercapnic. (Redrawn from West JB:
Regional differences in gas exchange in the lung of erect man. J Appl Physiol 17:893,
1962.)